
PARS Documentation
Usage of PARS web server to predict
Protein Allosteric and Regulatory Sites
Alejandro Panjkovich & Xavier Daura
November 29, 2013
Abstract
This documentation explains how to use the PARS web server, describes its input and results/output sections and includes a brief tutorial. A benchmark evaluating the performance of PARS on a set of 102 allosteric proteins is included as well.
Contents
- Input and job submission
- Protein structure and job parameters
- Chain selection table
- Ligand selection table
- on/off options
- Custom ligands and binding sites
- Amino-acid sequence job submission
- Results display and output description
- Results table
- Three-dimensional interactive display
- Active site and catalytic residues
- Other available results
- Visual normal modes comparison
- NMA B-factors display
- Tutorial
- PARS server pipeline
- PARS algorithm
- Benchmark on allosteric proteins
- Bibliography
Input and job submission
Protein structure and job parameters
PARS analyzes a protein structure in order to find allosteric or regulatory ligand-binding sites. To start working with PARS, you may upload a protein-structure file in PDB format (http://www.pdb.org/) or simply input a PDB identifier code and the server will fetch the structure file for you. If there is no available structure for the protein of your interest, please check section 1.6 on how to use PARS starting from just the protein sequence.Once the structure is uploaded to the server, a set of parameters is available and presented at the `Job parameters' page:
Chain selection table
If the uploaded protein structure has more than one protein chain, you can specify which protein chains should be analyzed. By default all chains are selected, but this may not be the best choice in all cases. For example, if you are interested in finding the allosteric site on the regulatory domain of a protein, you can exclude the catalytic domain from the calculation. Results may vary depending on how many domains are included and in general we have obtained better results by analyzing individual domains on different runs. Bear in mind that execution time increases exponentially according to the amount of residues included in the calculation. Thus, a protein complex containing two domains or chains will be analyzed faster by running two simulations (one for each domain) than by running a single simulation that includes both domains.
Ligand selection table
By default, PARS will predict ligand-binding sites on the protein surface by means of the LIGSITEcs program [Huang and Schroeder, 2006] and these sites will then be analyzed in terms of their structural conservation and their potential to affect protein flexibility, because both measures have been found of relevance in the characterization of protein allosteric sites [Panjkovich and Daura, 2012]. An experimentally solved protein structure may include small-molecule ligands and you can query these positions as well by simply selecting the ligands in the `Job parameters' form. By default, all ligands are pre-selected. Normal mode analysis is executed for each ligand-protein complex, meaning that total job execution time will increase with the number of included ligands.
on/off options
`predict protein pockets'
PARS will predict up to 8 ligand-binding sites on the protein structure by means of the LIGSITEcs program [Huang and Schroeder, 2006] by default. You may turn off this option by unchecking the corresponding checkbox if, for example, you just want to focus on binding sites which are already occupied by cocrystallized ligands. Turning off this option will shorten execution time considerably.
`check conservation and active site residues'
If sufficient structural information is available, PARS estimates the structural conservation of protein pockets as previously defined [Panjkovich and Daura, 2010]. Additionaly, part of the evolutionary queries involved in this process are used to predict active-site residues as well [Mistry et al., 2007]. If you already know the results of this analysis on your protein of interest or if you are only interested in the dynamic aspects of the analysis, you may turn off the estimation of structural conservation.
Custom ligands and binding sites
One of the main difficulties in predicting the correct location of an allosteric site lies in its initial identification as a ligand-binding site.
While working on a non-redundant set of 91 allosteric protein structures in our previous work [Panjkovich and Daura, 2012], we found out that around a third of the allosteric sites were not identified correctly as ligand-binding sites by LIGSITEcs [Huang and Schroeder, 2006].
This is understandable because allosteric sites, when compared to active sites or other primary ligand-binding sites, tend to have more planar shapes, which renders their identification harder.
Besides LIGSITEcs, there are multiple programs available that predict ligand-binding sites on protein structures, such as FPOCKET [Guilloux et al., 2009] or CONCAVITY [Capra et al., 2009], among many others.
In general, these programs display similar performance, meaning that well defined pockets are easily detected while difficult cases are often missed, as seen in large-scale comparisons [Chen et al., 2011,Schmidtke et al., 2010].
To partially overcome this limitation, you may use PARS to query alternative sites that are not already occupied by ligands or predicted by LIGSITEcs (e.g. predicted by your program of choice).
To do so, you can mark those particular sites by including dummy molecules as HET/HETATM entries in the structure file before uploading it.
They will appear in the ligands-selection table once the structure is uploaded.
Amino-acid sequence job submission
If your protein of interest lacks a known structure, you can submit the protein amino acid sequence and our servers will attempt to model its structure.
If a structural template is found, a model will be generated and it will be then analyzed by the rest of the PARS pipeline.
The homology modeling step is carried out by means of the MODELLER software [Eswar et al., 2008].
In order to use this feature, you will need to provide your own MODELLER License key, which is freely available for academics at the following URL: http://salilab.org/modeller/registration.html
Results display and output description
Upon successful completion of the PARS analysis, you will be able to access the results through the unique URL that is provided after submitting the job.
If you have entered your e-mail in the submission form, the results URL will also be sent to your inbox.
Results table
The results page displays a table with one or two columns and one row for each ligand or predicted cavity.
Each cavity and/or ligand is identified by a Site Id which includes the PDB three letter hetID, the sequential residue number and the chain identifier of the ligand occupying the cavity.
For example, the allosteric ligand beta-fructose-1,6-diphosphate found on chain T of PDB entry 1LTH is identified as FBP_320_T.
Cavities predicted automatically by the LIGSITEcs program [Huang and Schroeder, 2006] are identified using CAV as hetID and Z as chain identifier.
They are numbered according to volume in decreasing order, meaning that the largest cavity is number 1, while cavity number 2 is the second largest and so on.
Cavities and ligands in the table are ranked according to their potential as putative allosteric sites according to features described below.
The higher the rank, the higher the chance that the site is an allosteric site.
The first column of values displays a p-value for that cavity, which is used to evaluate whether an observed change in overall protein flexibility upon ligand binding is statistically significant [Panjkovich and Daura, 2012]. Values equal or below 0.05 are considered significant, i.e., the site is considered to have a potential regulation activity, and the number is highlighted on the table. The second column corresponds to the structural conservation estimated for that cavity. Structural conservation values correspond to the percentual fraction of representative protein structures of a Pfam family on which a pocket was identified in the same position. For example, a structural conservation of 100% would mean that the pocket is found in all structures of that protein family [Panjkovich and Daura, 2010]. We have selected an arbitrary threshold of 50% to consider cavities as structurally conserved. For some protein families there is not enough structural information to perform the estimation. In those cases the structural conservation column is not displayed.
The results table can be downloaded in plain text format through a link provided at the bottom of the page.
Three-dimensional interactive display
If your browser allows the execution of JAVA (http://www.java.com), you will be able to visualize the different cavities and ligands on the protein structure by means of the Jmol software (http://www.jmol.org/). The protein structure is shown using a cartoon representation. The different cavities predicted by LIGSITEcs (hetID CAV in the results table) are displayed using a dummy sphere in the corresponding position on the protein structure. If cocrystallized ligands were available and selected in the original structure, they will also be displayed using a full heavy-atom representation. By default cavity spheres and ligands are coloured yellow, but different colors are applied to highlight relevant features. Pockets found to be structurally conserved will be marked in cyan and those affecting flexibility will be colored orange. Sites matching both criteria will be highlighted in red, as these have the highest chance to be regulatory or allosteric sites according to the method.
Active site and catalytic residues
To complement the analysis, PARS attempts to predict the presence of active site or catalytic residues using an existing approach [Mistry et al., 2007].
If active site residues are predicted, they will be shown in white `sticks' representation on both the Jmol and PyMOL visualizations.
Additionally, predicted cavities and/or cocrystallized ligands that are near such catalytic residues (average distance less than 9 Å) will be colored in white as well.
Because such sites may bind substrates and/or orthosteric modulators, they are marked with the keyword CAT in the results table and penalized in the ranking to distinguish them from allosteric sites.
This distinction improves the correct identification of experimentally known allosteric sites (see Benchmark section 6).
Other available results
A series of download links are provided below the results table. The structure file can be downloaded in PDB format and it includes the coordinates for each predicted cavity and ligand shown in the display. Furthermore, a PyMOL (http://www.pymol.org/) script is provided which you can download and execute on your own computer using the PyMOL program to visualize the results, once you have downloaded both the script and the structure file. You can also download the results table in plain text format, and finally, a link is provided to the list of PDB and Pfam entries that were used in the estimation of structural conservation.If the job involved the generation of homology models, another link will appear for you to download the details of that procedure, such as sequence alignments and evaluation scores generated by MODELLER [Eswar et al., 2008].
Visual normal modes comparison
PARS compares the normal modes of the unbound and ligand-bound protein structure to estimate the effect a ligand binding site may have on overall protein flexibility.
Technically, PARS derives B-factors from normal mode anlaysis (NMA) and tests for a statistically significant difference [Panjkovich and Daura, 2012].
If you are interested in visualizing the actual normal modes of vibration that have been calculated for the submitted structure, please click on the `Compare normal modes visually' link available under `Further options' at the main results webpage.
The link will lead you to a new webpage where two Jmol displays are presented next to each other. Using the drop-down menus at the bottom of the Jmol windows, you can select which normal mode you want to display (the vibration will be animated by Jmol). You can activate the `NMA springs' option to observe the harmonic springs that are used to connect alpha carbons during the normal mode analysis.
In some cases there may be a clearly observable difference between apo and bound normal modes if, for example, the protein movement is restricted by the presence of the ligand, but this is not always straightforward to note visually. Furthermore, normal modes may switch order through different calculations (e.g. the normal mode 7 for an apo structure may correspond to the motion described by normal mode 8 on one of the ligand-bound structures). PARS overcomes this difficulty by transforming the lowest frequency normal modes (up to normal mode 20) into B-factors. Thus, it may be easier to understand the particular effect a site is exerting on protein flexibility upon ligand binding by looking at the B-factors that are derived from the NMA by PARS. You can do so through the utility that is described in the next section.
NMA B-factors display
If you are interested in taking a deeper look at the NMA derived B-factors used to estimate effects on protein flexibility, please follow the link `Explore NMA derived B-factors in detail' under `Further options' available at the main results webpage.
A new page will load displaying the results table as a guide. The protein structure is loaded on Jmol with a new coloring scheme. Below the Jmol display, a menu is available for you to select among different visualizations. The first option shows the protein structure and all the sites analyzed. Sites wil be colored yellow for a non-significant effect on protein flexibility and red if a significant effect was detected by PARS. Next, NMA derived B-factors for the apo or unbound protein structure can be visualized in temperature coloring (blue: low, red: high). The rest of the options correspond to the protein structure colored according to the difference between apo NMA derived B-factors and the NMA derived B-factors when a ligand is placed at the indicated site, with warmer colors corresponding to larger differences. This is helpful to understand which regions are affected by particular sites upon ligand binding, according to the NMA.
Tutorial
This tutorial section is intended to get you started with PARS.
We will use the structure of L-lactate dehydrogenase from Plasmodium falciparum, PDB entry 1CET, as a working example.
Job submission
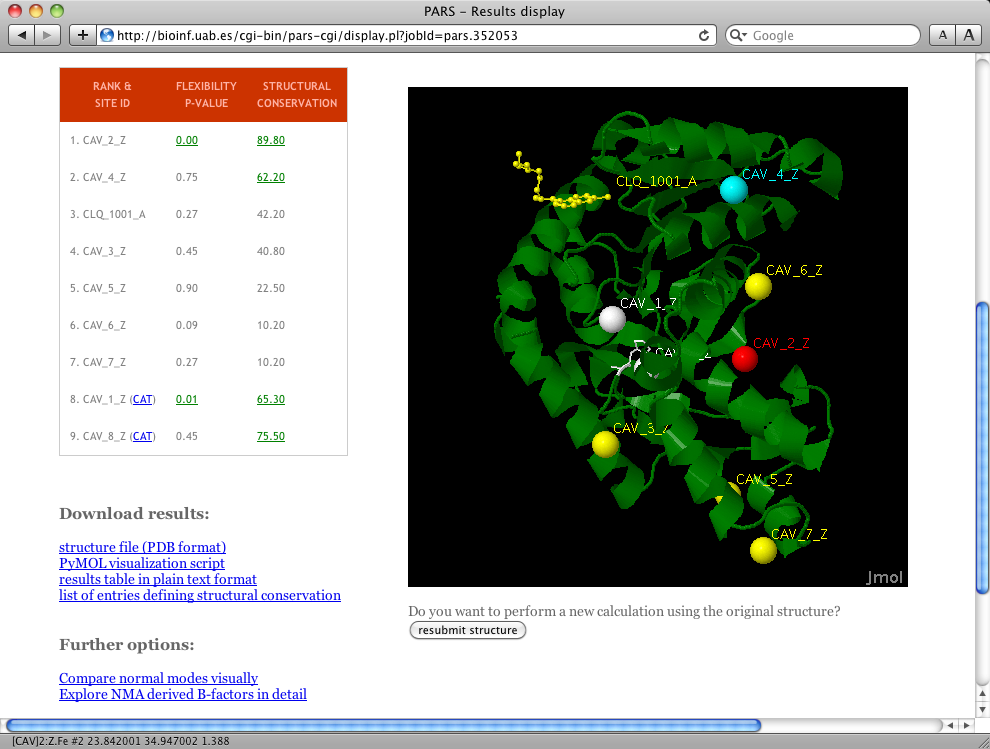
Open the PARS URL in your web browser `http://bioinf.uab.cat/pars' and click on `run prediction' at the header. Then, enter 1CET in the PDB-identifier field and click on `load structure'. Wait a moment while the server fetches the structure file for you and redirects to the `Job parameters' page. You can leave all options on default and click on `submit calculation'. Optionally, enter your e-mail and the system will send you a message once the calculation has finished. After submitting the calculation, an URL will be provided where you can view the results upon job completion, wait a few minutes and click on it. The results webpage should look very similar to the screenshot in Figure 1.
Results display
On the left you can see the results table, where calculated values are reported for each predicted cavity (CAV_1_Z to CAV_8_Z and the cocrystallized diamine identified as CLQ_1001_A). The results table is a ranking, meaning that the first ranked sites have the highest chance of being allosteric or regulatory sites. The first column is the p-value of flexibility calculations; values equal or below 0.05 are considered significant. In our example, two cavities (i.e. CAV_1_Z and CAV_2_Z) show significant p-values. This means that the associated binding sites have a significant chance of altering overall protein flexibility upon ligand binding. Thus, these are in principle good regulatory or allosteric site candidates. However, CAV_1_Z is located very close to the predicted catalytic residues. The same happens with CAV_8_Z. Because of their proximity to the catalytic residues (meaning they may correspond to the active site cavity, substrate or orthosteric modulator binding site), PARS marks them with the keyword CAT and their position in the ranking is penalized.The second column in the table contains structural conservation values as percentages. Values equal or higher than 50% are considered relevant, meaning that the site has been conserved during the evolution of this protein family. In our example with PDB entry 1CET, cavities CAV_2_Z, CAV_2_Z, CAV_4_Z and CAV_8_Z show relevant structural conservation values.
On the right, and if JAVA is working properly on your browser, the protein structure of L-lactate dehydrogenase is displayed along with the predicted cavities. A color scheme is applied to reflect the different results obtained for each site. Cocrystallized ligands in full atom balls and stick representation and predicted cavities (displayed as geometric center dummy spheres) are colored yellow by default.
In our example, CAV_4_Z is colored cyan because it is structurally conserved, but the PARS analysis did not consider this site relevant in terms of altering protein flexibility upon ligand binding. CAV_1_Z and CAV_8_Z have been colored white, because they are very close to predicted catalytic residues. Catalytic residues are also colored white and displayed using sticks representation.
CAV_2_Z is colored red because it shows relevant values for both structural conservation and flexibility (it is ranked at top 1 position in the ranking table), meaning that it is the best candidate to be a regulatory or allosteric site. In fact, this is a correct prediction because the cavity matches the position of the known allosteric site of this protein.
PARS server pipeline
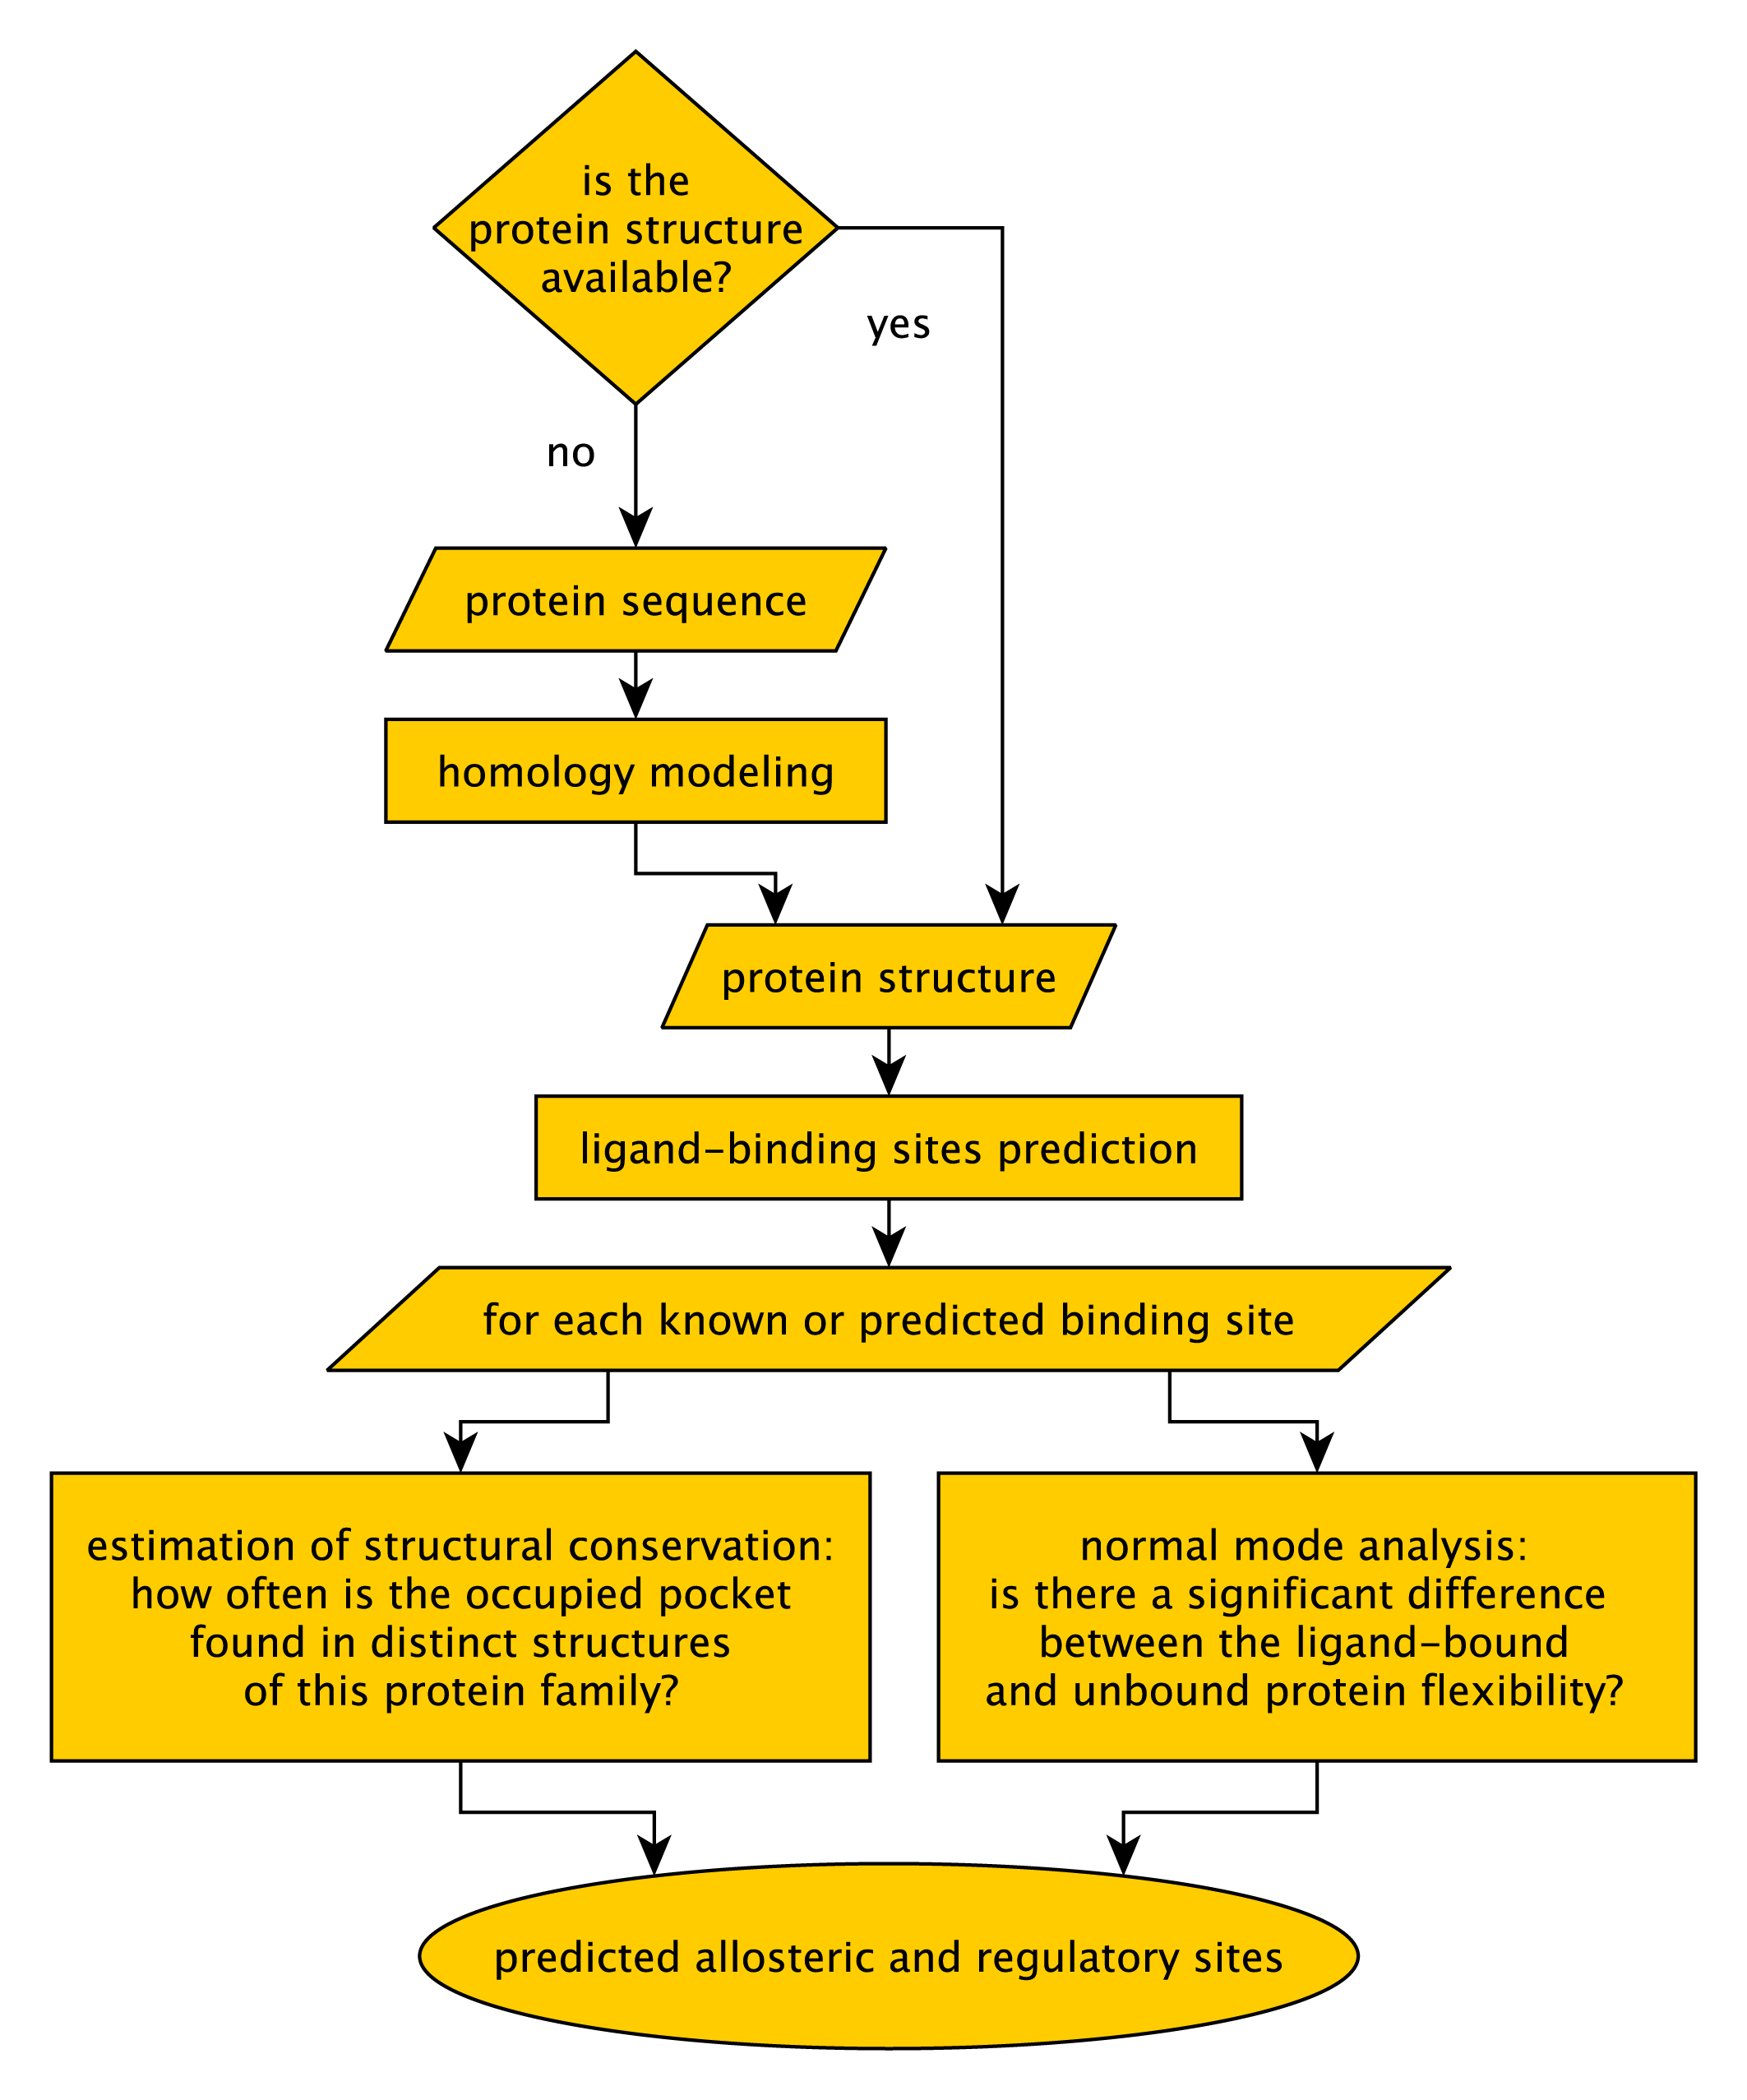
The PARS web server works as illustrated in Figure 2. PARS was developed to work on protein structures. However, if no structure is available for your protein of interest, the server will take the protein sequence as input and it will attempt to generate a structural model using the MODELLER software [Eswar et al., 2008]. This can only be done if appropriate structural templates are found, which is not always the case.Once the structure is uploaded, or modeled by homology, the PARS algorithm is applied to characterize putative binding pockets regarding their potential as regulatory or allosteric sites. The details of the PARS algorithm are explained in the next section.
PARS algorithm
PARS attempts to predict ligand-binding sites which may have a regulatory effect on the protein function upon ligand binding.The procedure is as follows: (1) Initially the user uploads a protein-structure file (PDB format) and selects which chains and ligands should be considered for the calculations. (2) Once the job is submitted, the protein surface is analyzed to predict putative ligand-binding sites using the LIGSITEcs program [Huang and Schroeder, 2006]. (3) At each predicted position, a simplified representation of a small-molecule is placed to simulate the presence of a ligand. We use an octahedron representation where the ligand's presence is simulated by a dummy atom positioned at the geometric center and six extra dummy atoms located at 4 Å distance from the center on both sides of each axis (i.e. forming the vertices of a regular octahedron). Alternatively, upon submission, the prediction of putative ligand-binding sites can be turned off if you are interested in scanning only sites which are already occupied by a ligand in the protein structure, this will result in faster execution times. (4) Normal mode analysis (NMA) is carried out for the apo structure (without ligands) using a set of available programs [Tama et al., 2000,Delarue and Sanejouand, 2002]. (5) For each binding site, a NMA is executed for the protein-ligand complex. (6) Normal modes are transformed into B-factors and the Wilcoxon-Mann-Whitney test is applied to check for a significant difference in overall B-factors between the apo and ligand-bound states of the protein. If a significant difference is found (Wilcoson-Mann-Whitney test p-value equal or less than 0.05), the binding site is marked as potentially allosteric.
Moreover, if enough structural data is available for the protein family, the structural conservation of each pocket is also measured.
We have previously described how allosteric sites may be structurally conserved within a protein family [Panjkovich and Daura, 2010] and that the incorporation of this measure improves the capacity of the method based on dynamics to correctly identify allosteric sites [Panjkovich and Daura, 2012].
Additionaly, and to complement the characterization of your protein of interest, PARS will attempt to predict active site residues, using an existing methodology [Mistry et al., 2007].
Limitations
PARS has been implemented to exploit the link between changes in protein flexibility and allosteric effects.
It complements the predictions using structural conservation.
However, allostery is characterized by its phenomenological variety, and particular allosteric mechanisms may not be primarily driven by changes in overall flexibility, but by specific conformational changes, oligomerization or other mechanisms [Tsai et al., 2009].
In addition, our method is based on a coarse-grained normal mode analysis, which is a harmonic approximation to flexibility based on a simplified representation of the protein molecule (i.e. alpha carbons only) [Tama et al., 2000].
Moreover, as mentioned in detail in the section regarding custom ligands and binding sites, the approach has limitations as to how often allosteric sites are identified correctly as ligand-binding sites at the initial steps of the procedure, independently of the background software used.
Despite these limitations, the method can be used successfully to detect allosteric sites as illustrated by the benchmark described in the next section.
Benchmark on allosteric proteins
Allosteric proteins data set
To measure the performance of PARS, we tested the method on a set of allosteric protein structures. We have updated our previously compiled benchmark data set [Panjkovich and Daura, 2012] to include the latest 2013 AlloSteric Database (ASD) entries [Huang et al., 2011]. Briefly, protein structures of least 3.0 Å resolution that included the cocrystallized allosteric ligand were clustered (30% sequence identity) to avoid overrepresentation into a manually curated selection of 102 structures.
Non-filtered benchmark
A cavity is considered allosteric when its geometric center is less than 5.0 Å away from the known allosteric ligand. The benchmark presented here evaluates if PARS is able to correctly identify such a cavity as allosteric using two criteria: one is structural conservation (S) and the other is the overall effect on protein flexibility upon ligand-binding (F). Table 1 shows the results for the different criteria and their combination (FS). Moreover, cavities are predicted by LIGSITEcs in descending volume or size, meaning that cavity number 1 is the largest, cavity 2 is the second largest and so on. As described previously, the order of the cavity may be important, given that usually the largest cavities match biologically relevant ligand-binding sites [Panjkovich and Daura, 2012]. This is why benchmark results are presented in three different groups, one includes all predicted cavities (up to 8 per structure, first four rows in Table 1), c123 includes only the three largest cavities (i.e. the default approach by LIGSITEcs) and finally c1 considers only the largest cavity (last four rows in Table 1). Cavities that are too close to predicted catalytic residues [Mistry et al., 2007] and may correspond to the active site are discarded.Results on rows 1, 5 and 9 of Table 1 illustrate how difficult it is to identify the allosteric site based only on LIGSITEcs predictions. Incorporating structural conservation (S) or the flexibility criterium (F) increases accuracy, specificity and positive predictive value (PPV) in all cases, but sensitivity decreases. When looking at the first four rows of Table 1 (default behaviour of PARS), the combination of F and S criteria (FS, row 4) allows PPV to triplicate when compared to plain LIGSITEcs (row 1). Accuracy goes from 0.12 to 0.88 and specificity rises to 0.96 from the original 0.03 at the expense of sensitivity, which falls to 0.22. Numbers for the c123 and c1 sets follow the same trend, i.e. accuracy, precision and PPV increase at the cost of sensitivity. This means that even if some allosteric sites may be missed by PARS, the chance that a positive prediction will be correct is very high if the site is detected by LIGSITEcs.
| Set | TP+FP | TP | FP | FN | Sensitivity | Specificity | Accuracy | PPV |
| Total | 793 | 78 | 715 | 0 | 1.00 | 0.03 | 0.12 | 0.10 |
| F | 193 | 45 | 148 | 33 | 0.58 | 0.80 | 0.78 | 0.23 |
| S | 169 | 30 | 139 | 48 | 0.38 | 0.81 | 0.77 | 0.18 |
| FS | 50 | 17 | 33 | 61 | 0.22 | 0.96 | 0.88 | 0.34 |
| c123 | 288 | 57 | 231 | 21 | 0.73 | 0.69 | 0.69 | 0.20 |
| c123F | 119 | 38 | 81 | 40 | 0.49 | 0.89 | 0.85 | 0.32 |
| c123S | 82 | 23 | 59 | 55 | 0.29 | 0.92 | 0.86 | 0.28 |
| c123FS | 39 | 14 | 25 | 64 | 0.18 | 0.97 | 0.89 | 0.36 |
| c1 | 91 | 30 | 61 | 48 | 0.38 | 0.92 | 0.87 | 0.33 |
| c1F | 59 | 24 | 35 | 54 | 0.31 | 0.95 | 0.89 | 0.41 |
| c1S | 32 | 15 | 17 | 63 | 0.19 | 0.98 | 0.90 | 0.47 |
| c1FS | 21 | 11 | 10 | 67 | 0.14 | 0.99 | 0.91 | 0.52 |
Filtered data set
Table 1 includes 27 proteins for which none of the 8 (total of 216) predicted cavities match the allosteric site. Identifying allosteric sites as ligand-binding sites is the initial step of PARS, required to further evaluate cavities in terms of structural conservation and flexibility effects. This is not trivial, as explained above (see Limitations, section 5.1).A ligand-binding site or cavity which is not predicted by LIGSITEcs may nevertheless be occupied by a cocrystallyzed ligand or identified previously by the user using another software (e.g. FPOCKET [Guilloux et al., 2009] or CONCAVITY [Capra et al., 2009]). These cavities may be also selected (cocrystallized compounds) or introduced (cavities detected by a different software) by the user for their inclusion in the analysis, as explained in the section on custom ligands (1.5).
To illustrate the performance of PARS in such cases (i.e. the allosteric site is included among the set of cavities that will be evaluated), the 27 cases where no LIGSITEcs prediction matched the allosteric site where filtered out from the benchmark and the results are displayed in Table 2. As expected, PPV increases reaching in the best case 0.79.
| Set | TP+FP | TP | FP | FN | Sensitivity | Specificity | Accuracy | PPV |
| Total | 550 | 78 | 472 | 0 | 1.00 | 0.04 | 0.17 | 0.14 |
| F | 146 | 45 | 101 | 33 | 0.58 | 0.79 | 0.76 | 0.31 |
| S | 122 | 30 | 92 | 48 | 0.38 | 0.81 | 0.75 | 0.25 |
| FS | 34 | 17 | 17 | 61 | 0.22 | 0.97 | 0.86 | 0.50 |
| c123 | 198 | 57 | 141 | 21 | 0.73 | 0.71 | 0.71 | 0.29 |
| c123F | 86 | 38 | 48 | 40 | 0.49 | 0.90 | 0.85 | 0.44 |
| c123S | 58 | 23 | 35 | 55 | 0.29 | 0.93 | 0.84 | 0.40 |
| c123FS | 25 | 14 | 11 | 64 | 0.18 | 0.98 | 0.87 | 0.56 |
| c1 | 63 | 30 | 33 | 48 | 0.38 | 0.93 | 0.86 | 0.48 |
| c1F | 41 | 24 | 17 | 54 | 0.31 | 0.97 | 0.88 | 0.59 |
| c1S | 23 | 15 | 8 | 63 | 0.19 | 0.98 | 0.88 | 0.65 |
| c1FS | 14 | 11 | 3 | 67 | 0.14 | 0.99 | 0.88 | 0.79 |
Results on this table refer to the subset of 75 proteins for which LIGSITEcs was able to predict a ligand-binding pocket in the position of the allosteric site. TP: true positive; TN: true negative; FP: false positive; FN: false negative; PPV: positive predictive value. Sensitivity: TP/(TP+FN); specificity: TN/(TN+FP); accuracy: (TP+TN)/(TP+FN+TN+FP); PPV or precision: TP/(TP+FP). F corresponds to sets including a change in flexibility as selection criterion; S corresponds to sets including high structural conservation as selection criterion; c123 refers to sets considering only the three largest pockets predicted by LIGSITEcs; c1 refers to sets considering only the largest predicted pocket.
Ranking
Cavities predicted and analyzed by PARS are displayed in a table in the main results webpage. The order of cavities in the table represent a ranking with the top cavities (and/or cocrystallized ligands) being the best candidates to allosteric or regulatory sites according to the PARS analysis. In this sense, a simpler way to illustrate the performance of PARS is to count how many times predicted cavities matching the experimentally known allosteric site of the analyzed protein structure appear on position 1, 2 or 3 of the particular results table. If we consider all the cavities matching an allosteric site in our benchmark, 44% appear in position 1 and 18% in position 2. If we consider the top three posititions together, they include 73% of the cavities matching allosteric sites.
Acknowledgements
This project is supported by funding under the Seventh Research Framework Programme of the European Union (ref. HEALTH-F3-2009-223101). AP acknowledges the FPU Scholarship from MICINN, Spanish Gov.
Bibliography
- Capra et al., 2009
-
Capra,J.A., Laskowski,R.A., Thornton,J.M., Singh,M. and Funkhouser,T.A.
(2009) Predicting protein ligand binding sites by combining
evolutionary sequence conservation and 3d structure.
PLoS Comput Biol, 5 (12), e1000585. - Chen et al., 2011
-
Chen,K., Mizianty,M.J., Gao,J. and Kurgan,L. (2011) A critical
comparative assessment of predictions of protein-binding sites for
biologically relevant organic compounds.
Structure, 19 (5), 613-621. - Delarue and Sanejouand, 2002
-
Delarue,M. and Sanejouand,Y.H. (2002) Simplified normal mode analysis of
conformational transitions in dna-dependent polymerases: the elastic network
model.
J Mol Biol, 320 (5), 1011-1024. - Eswar et al., 2008
-
Eswar,N., Eramian,D., Webb,B., Shen,M.Y. and Sali,A. (2008) Protein
structure modeling with modeller.
Methods Mol Biol, 426, 145-159. - Guilloux et al., 2009
-
Guilloux,V.L., Schmidtke,P. and Tuffery,P. (2009) Fpocket: an open
source platform for ligand pocket detection.
BMC Bioinformatics, 10, 168. - Huang and Schroeder, 2006
-
Huang,B. and Schroeder,M. (2006) Ligsitecsc: predicting ligand binding
sites using the connolly surface and degree of conservation.
BMC Struct Biol, 6, 19. - Huang et al., 2011
-
Huang,Z., Zhu,L., Cao,Y., Wu,G., Liu,X., Chen,Y., Wang,Q., Shi,T., Zhao,Y.,
Wang,Y., Li,W., Li,Y., Chen,H., Chen,G. and Zhang,J. (2011) Asd: a
comprehensive database of allosteric proteins and modulators.
Nucleic Acids Res, 39 (Database issue), D663-D669. - Mistry et al., 2007
-
Mistry,J., Bateman,A. and Finn,R.D. (2007) Predicting active site
residue annotations in the pfam database.
BMC Bioinformatics, 8, 298. - Panjkovich and Daura, 2010
-
Panjkovich,A. and Daura,X. (2010) Assessing the structural conservation
of protein pockets to study functional and allosteric sites: implications for
drug discovery.
BMC Struct Biol, 10, 9. - Panjkovich and Daura, 2012
-
Panjkovich,A. and Daura,X. (2012) Exploiting protein flexibility to
predict the location of allosteric sites.
BMC Bioinformatics, 13 (1), 273. - Schmidtke et al., 2010
-
Schmidtke,P., Souaille,C., Estienne,F., Baurin,N. and Kroemer,R.T.
(2010) Large-scale comparison of four binding site detection
algorithms.
J Chem Inf Model, 50 (12), 2191-2200. - Tama et al., 2000
-
Tama,F., Gadea,F.X., Marques,O. and Sanejouand,Y.H. (2000)
Building-block approach for determining low-frequency normal modes of
macromolecules.
Proteins, 41 (1), 1-7. - Tsai et al., 2009
-
Tsai,C.J., Sol,A.D. and Nussinov,R. (2009) Protein allostery, signal
transmission and dynamics: a classification scheme of allosteric mechanisms.
Mol Biosyst, 5 (3), 207-216.
2013-11-29